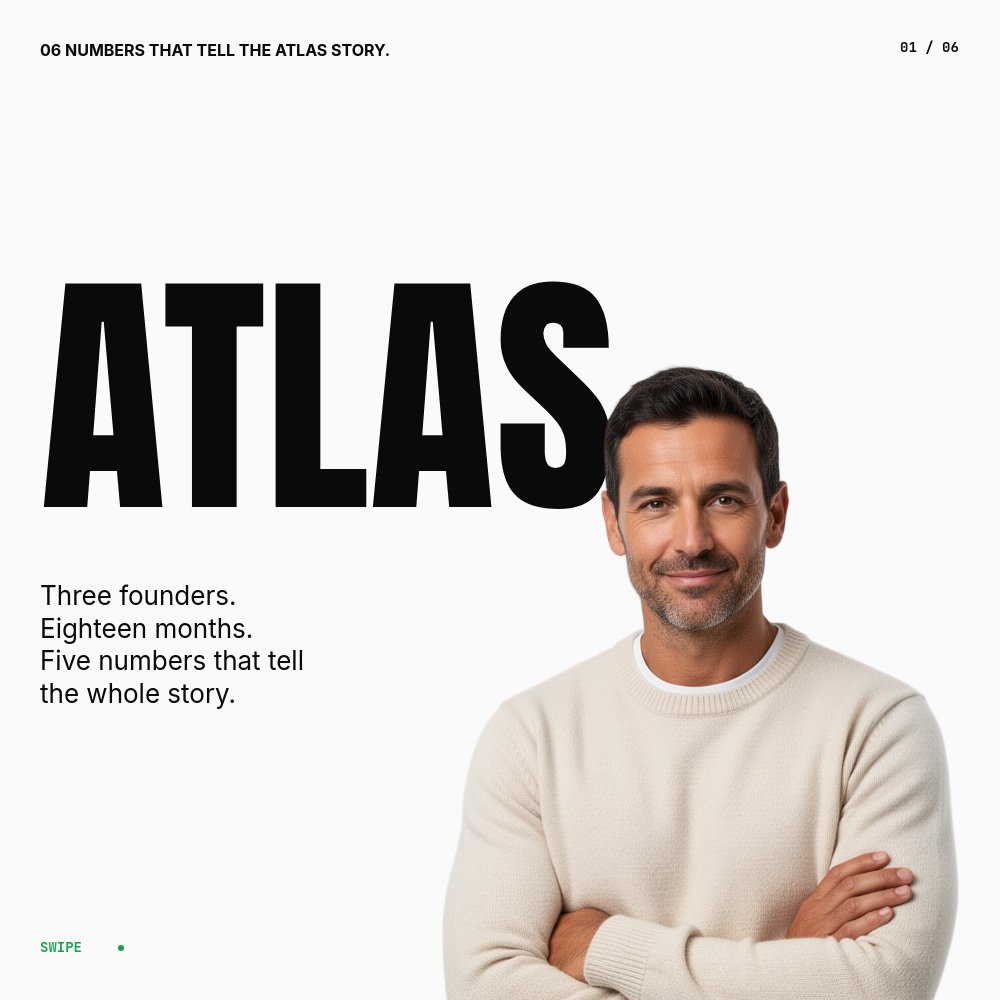
Stat Hero - Number Beside Cutout Template
A 1:1 stat-driven slideshow for founders, growth marketers, and operators sharing the numbers behind a story. Six panes of Inter Tight Black numerals at 70cqw, Anton headline support, signal-green accent for the climb stats, and a cutout subject that flanks, pierces, or sits inside every number. Built for LinkedIn carousel, Twitter image, and Instagram feed - the format that gets screenshotted and quote-tweeted.
#What Makes This Template Stand Out
The defining choice is making the stat the entire pane. Most "by the numbers" decks pile three or four metrics into a single slide and lose the impact of all of them. This template gives every number its own square canvas, every digit at hero scale, and a same-subject cutout that physically interacts with the number. On pane 2 the cutout stands beside "98%" with arms folded. On pane 3 the cutout replaces the percent symbol with a body-as-glyph pose. On pane 4 the cutout fits inside the counter of a round digit. On pane 5 the cutout walks the arrow path between "$50K" and "$2.4M" as the visual connector of the climb stat.
The compositional vocabulary - beside, replaces, inside, connects - is what separates a stat poster from a stat dump. Every pane uses a different image-and-type move, so the carousel reads as composed rather than templated. The palette holds a tight grip: #fafafa near-white canvas, #0a0a0a near-black type, #16a34a signal green only on the climb stats, #dc2626 red reserved for contrast moments. The square 1:1 format crops cleanly to every social platform without rework.
Animation does the heavy lifting on each beat. number-roll on every numeric value counts up from zero to the target as the pane lands, then the cutout drops in 400ms after the number settles. Per-letter letter-scale on the caption text underlines the number with a typographic flex. The green accent fades in last on the climb stat with pop. Three-second autoplay per pane gives the count-up time to land before the next stat takes over.
- 1:1 square format with #fafafa canvas, #0a0a0a type, and #16a34a signal-green accent on climb stats
- Inter Tight Black numerals at roughly 70cqw paired with Anton 800 captions and Inter 500 sub-captions
- Number-roll animation on every numeric child counts up from zero to target on each pane
- Five distinct image-and-type moves across the deck - beside, replaces (%), inside-counter (0), arrow-walker, recap
- Same-subject cutout consistency across 6 panes with confident, percent-pose, counter-fit, mid-stride, and sign-off gestures
- 6-pane carousel arc - setup, four stat panes with rotating compositions, recap sign-off with brand mark and URL
#Who Should Use This Template
- Founders posting milestone updates on LinkedIn or Twitter. The square format and stat-first composition out-perform a generic announcement post when the news is a number (ARR crossed, customers reached, hires made).
- Growth marketers and operators sharing quarterly recaps, growth-experiment results, or annual reports. The four-stat structure fits the standard "98% retention / 47 NPS / 11 countries / $2.4M" recap framing without padding.
- Sales and BD teams building one-pager talking points for outbound and customer conversations. Each pane can be exported as a single PNG and pasted into emails, Loom thumbnails, or QBR decks.
- Newsletter and creator economy operators sharing audience growth, engagement, or revenue numbers in a way that feels designed, not screenshot-from-Stripe. The signal-green accent on the climb stat reads as growth in one glance.
#Best Use Cases
#Founder LinkedIn Milestone Posts
When a milestone hits - first $1M, first 10,000 customers, first profitable quarter - the announcement post on LinkedIn lives or dies on the carousel. This template lets you swap the six stats, hit publish, and post a carousel that looks designed for the milestone rather than retrofitted. The square format expands fully in the LinkedIn carousel viewer, and the number-roll animations translate to GIF or MP4 export for static-image platforms.
#Year-In-Review and Quarterly Recaps
Operators sharing a public year-end recap thread on Twitter or a quarterly update on LinkedIn get a built-in narrative structure with this template. Cover sets up the count ("06 NUMBERS THAT TELL THE ATLAS STORY"), each stat pane lands one metric with its own compositional move, and the recap signs off with brand mark plus URL. Export to MP4 for in-feed video, or export individual panes as PNG for thread cards.
#Investor Updates and Board Decks
For monthly investor updates and quarterly board reviews, the stat-hero panes function as the "by the numbers" section of a longer deck. The compositional consistency across stats reads as deliberate and the unit-symbol replacement on pane 3 is the kind of design move that makes the update memorable. Combine with longer-form pitch templates for the full update flow.
#How to Customize This Template
- Open PaneFlow and select "Stat Hero - Number Beside Cutout" from the template gallery
- Edit the kicker on the cover pane ("06 NUMBERS THAT TELL THE ATLAS STORY") with your brand name and stat count
- Update each stat number on panes 2-5 - the digits, the unit symbol, the caption, and the sub-caption are independent children
- Swap the cutout PNGs with your own background-removed subject (same person across all 5 cutout panes for continuity)
- On pane 4, confirm your chosen stat contains a round digit (0, 8, 6, 9) so the inside-counter move reads
- Adjust the signal-green accent if your brand color differs - one color token, applied to the climb stats only
- Edit the recap sign-off on pane 6 with your brand mark and URL
- Export to MP4 for LinkedIn or Twitter video, PNG sequence for static carousel, or HTML to embed in a recap blog post
#Related Templates
- Athlete Manifesto - Action Cutout - 3:4 stat-and-manifesto deck for performance brands
- LinkedIn Carousel - Stat Insight - stat-led LinkedIn carousel with a calmer aesthetic
- Hiring Announcement - Square - square 1:1 announcement format for social
- Punk Zine - Anti-Design Chaos - opposite-end aesthetic for the same square social slot
#Related Resources
- PaneFlow for Startups - milestone announcements and investor-update templates
- PaneFlow for Marketers - growth recaps and stat-driven social posts
- PaneFlow vs Canva - why PaneFlow ships animated stat carousels Canva flattens to static
Start with Stat Hero - Number Beside Cutout
Open this template in PaneFlow, customize it to match your brand, and export as HTML, React, Vue, or video.