Spotify Wrapped Style Template - Personal Year Recap
A Spotify Wrapped style template for any app sending a personal year-in-review to its users. 10 square panes wrap a hyped, share-worthy story around the numbers that matter: a hero stat, a peak moment, a discovery, a streak, a percentile flex, a highlight reel, and a one-word theme that defines the year. Vibrant gradients, oversized type, number-roll animations on every figure - built to feel celebratory and built to be screenshotted.
#What Makes This Template Stand Out
The defining choice in this template is gradient overload, used with discipline. Most "vibrant" templates pile on color until the eye has nowhere to land. This one stacks two or three large gradient shapes per pane - violet bleeding into magenta, orange splashing into pink, teal drifting into purple - and lets the type do the rest. Every pane is a different gradient composition, so swiping through reads as a sequence of moods rather than ten variations on the same screen.
Typography is Sora 800 set absurdly large for the hero numbers. Pane 2 puts "847" at three-quarters of the canvas height. Pane 5 makes "PHONK" the biggest thing on screen. Pane 7 stretches "TOP 0.3%" across the frame and pane 9 hands the whole pane to a single year word like "EXPLORER". The point of the typography is the screenshot - when someone shares pane 4 on a story, the stat needs to read at thumb height and the format needs to survive heavy compression. This template is designed for that exact moment.
Motion is where the share-worthy feel comes from. Stat panes use number-roll so the hero figure ticks up from zero as the pane lands. Words use letter-blur and pop so they punch in. The gradient blobs have parallax 8 set on a translateY, so they drift behind the type as the user swipes - subtle but enough to make the panes feel three-dimensional. The highlight reel pane uses succession to release the three mini stats one beat at a time, which gives the recap a rhythm rather than a wall of numbers.
- 10-pane 1:1 square format sized native for Instagram and TikTok stories
- Per-pane gradient backgrounds running through violet, magenta, orange, teal, and pink
- Sora 800 typography sized absurdly large for hero stats and year word
- Number-roll animation on every figure so stats tick up from zero on entry
- Layered gradient shapes with parallax 8 drift for three-dimensional depth
- Built-in share CTA pane with handle and hashtag slot for branded distribution
#Who Should Use This Template
- Music, podcast, and audio app teams who want a Wrapped-style year recap to send users in December. The 10 categories - hero stat, peak moment, discovery, streak, percentile, highlight reel, year word - map directly to the data these apps already track.
- Fitness, wellness, and habit-tracking apps running a year-in-review for users. Swap "songs played" for "workouts logged", "top genre" for "favorite class type", and the format reads as natural to a Strava, Peloton, or Headspace audience.
- Fintech and productivity apps building user-facing recaps that feel celebratory rather than corporate. The vibrant palette breaks the convention of charts and bar graphs and reframes the year as a personal story.
- Marketing teams building social campaigns around a "your year" moment. Even without an app, the template works as a brand recap, a creator recap, or a community recap where the audience is invited to share their own version.
#Best Use Cases
#Spotify Wrapped Style App Recaps
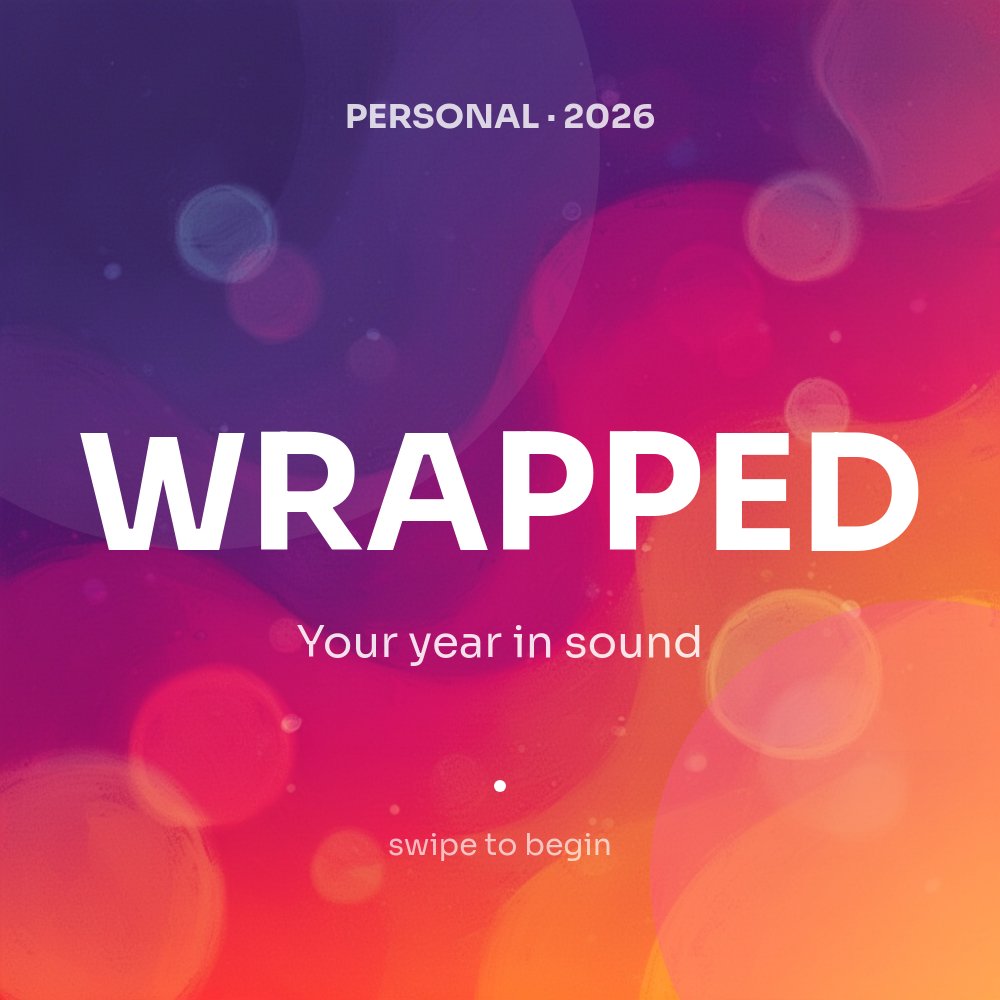
The whole template is built around the Wrapped format and runs through the same beats: cover with a glowing wordmark, hero stat with a big number that lands the year's headline figure, peak moment that ties a date to a behavior, new discovery that calls out something the user adopted, streak that rewards consistency, percentile that gives the user a flex to share, highlight reel that compresses three more stats into one pane, year word that abstracts the data into a single label, and a share CTA. Drop your own metrics in and the structure does the rest.
#Personal Year in Review for Creators and Communities
The template doesn't have to come from an app. Creators running a year-end recap on Twitter, Substack, or YouTube can use the same structure to summarize their own year - top post, biggest spike, most-mentioned topic, longest streak, percentile inside their niche, three more highlights, the year's word. Export each pane as a separate share image and post the sequence as a thread or carousel.
#Branded Year-End Marketing Campaigns
For consumer brands running a "thank you for a great year" moment, the template works as a campaign asset. Replace the personal stats with brand stats - units sold, customers reached, countries shipped to, biggest day, top product, top region - keep the celebratory tone, and you have a 10-pane Wrapped-style brand recap that lands warmer than a corporate annual report.
#How to Customize This Template
- Open PaneFlow and select "Personal Wrapped - Vibrant" from the template gallery
- Replace the wordmark and dateline on the cover pane with your app or brand name and year
- Update each hero stat with your real numbers - the number-roll animation handles any figure you enter
- Swap the peak-moment date and behavior copy on pane 4 to match your data
- Edit the discovery, streak, and percentile panes with categories your app actually tracks
- Replace the three highlight-reel mini stats with your top three additional figures
- Choose a single year word that defines the user's year and update the reflection caption
- Set the share handle and hashtag on the closing pane and export each pane as a 1080x1080 JPG
#Related Templates
- Creator Recap - Editorial - the editorial newsletter counterpart for writers and podcasters
- Company Year Recap - Corporate - the navy-and-gold corporate annual recap variant
- LinkedIn Stat-Driven Carousel - stat-led square format for B2B audiences
- Instagram Story - Fashion - vertical story format with similar share-ready aesthetic
#Related Resources
- PaneFlow for Content Creators - share-ready templates and recap formats for creators on every platform
- PaneFlow for Marketers - campaign assets, year-end recaps, and social-first slideshows
- PaneFlow vs Canva - how PaneFlow compares to Canva for animated, share-ready recap templates
Start with Personal Wrapped - Vibrant
Open this template in PaneFlow, customize it to match your brand, and export as HTML, React, Vue, or video.